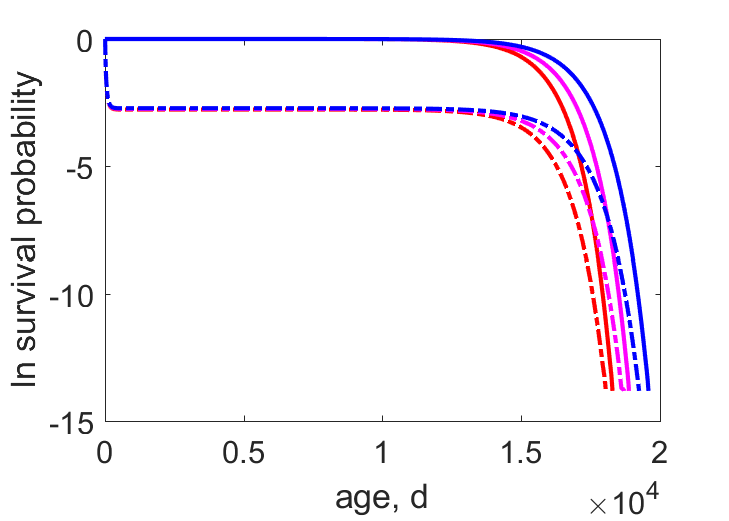
Ln survival probability as function of age,
with (dashed) and without (solid) thinning at max (red) and min (blue) scaled functional response for females.
| model std | f_min | f | f_max | date: 2020/12/04 | ||||||||||
|---|---|---|---|---|---|---|---|---|---|---|---|---|---|---|
| symbol | units | thinning false | thinning true | thinning false | thinning true | thinning false | thinning true | description | ||||||
| female | male | female | male | female | male | female | male | female | male | female | male | |||
| f | - | 0.972188 | 0.972188 | 0.973865 | 0.973865 | 0.986932 | 0.986932 | 0.986932 | 0.986932 | 1 | 1 | 1 | 1 | scaled functional response |
| r | 1/d | 0 | 0 | 0 | 0 | 0.00276855 | 0.00276855 | 0.000449766 | 0.000449766 | 0.0039707 | 0.0039707 | 0.000762371 | 0.000762371 | spec pop growth rate |
| t2 | d | NaN | NaN | NaN | NaN | 250.364 | 250.364 | 1541.13 | 1541.13 | 174.565 | 174.565 | 909.199 | 909.199 | population doubling time |
| a_b | d | 10.3663 | 10.2482 | 10.3639 | 10.246 | 10.3459 | 10.2287 | 10.3459 | 10.2287 | 10.3282 | 10.2118 | 10.3282 | 10.2118 | age at birth |
| t_p | d | 794.184 | 242.814 | 569.924 | 241.214 | 392.962 | 229.825 | 392.962 | 229.825 | 339.715 | 220.015 | 339.715 | 220.015 | time since birth at puberty |
| S_b | - | 1 | 1 | 1 | 1 | 1 | 1 | 1 | 1 | 1 | 1 | 1 | 1 | survival probability at birth |
| S_p | - | 1 | 1 | 0.515555 | 0.49613 | 1 | 1 | 0.512558 | 0.493318 | 1 | 1 | 0.509628 | 0.490569 | survival probability at puberty |
| theta_0b | - | 0.000658789 | 0.000604331 | 0.00980073 | 0.0106792 | 0.0282261 | 0.0279117 | 0.0603694 | 0.069106 | 0.0401658 | 0.0397234 | 0.0931963 | 0.105234 | fraction of individuals that is embryo |
| theta_bp | - | 0.000659052 | 0.000604556 | 0.00698399 | 0.00746481 | 0.0274397 | 0.0271422 | 0.0427053 | 0.0479601 | 0.0385666 | 0.0381585 | 0.0655382 | 0.0726116 | fraction of individuals that is juvenile |
| theta_pi | - | 0.998682 | 0.998791 | 0.983215 | 0.981856 | 0.944334 | 0.944946 | 0.896925 | 0.882934 | 0.921268 | 0.922118 | 0.841266 | 0.822154 | fraction of individuals that is adult |
| L_bi | cm | 16.6483 | 18.1934 | 16.5161 | 18.0288 | 14.8568 | 16.0877 | 15.5537 | 16.7695 | 14.3083 | 15.4428 | 14.9346 | 15.9837 | mean structural length of post-natals |
| L2_bi | cm^2 | 277.512 | 331.425 | 274.666 | 327.584 | 230.826 | 271.873 | 252.767 | 296.486 | 217.323 | 254.649 | 239.018 | 277.502 | mean squared structural length of post-natals |
| L3_bi | cm^3 | 4628.81 | 6041.28 | 4580.52 | 5970.06 | 3675.99 | 4717.86 | 4186.06 | 5356.75 | 3415.19 | 4355.28 | 3946.05 | 4992.39 | mean cubed structural length of post-natals |
| Ww_bi | g | 9384.22 | 12823.7 | 9294.43 | 12684.1 | 7509.79 | 10094.8 | 8551.84 | 11461.9 | 7024.17 | 9384.76 | 8116 | 10757.6 | mean wet weight of post-natals |
| L_pi | cm | 16.6559 | 18.2013 | 16.5975 | 18.127 | 15.1388 | 16.3999 | 16.0533 | 17.4026 | 14.6913 | 15.8656 | 15.7032 | 16.9429 | mean structural length of adults |
| L2_pi | cm^2 | 277.678 | 331.609 | 276.434 | 329.875 | 236.754 | 278.893 | 263.57 | 311.155 | 225.296 | 264.045 | 255.618 | 299.669 | mean squared structural length of adults |
| L3_pi | cm^3 | 4631.77 | 6044.85 | 4612.11 | 6014.41 | 3778.72 | 4849.17 | 4379.03 | 5640.22 | 3552.25 | 4529.42 | 4243.02 | 5421.06 | mean cubed structural length of adults |
| Ww_pi | g | 9390.22 | 12831.3 | 9358.54 | 12778.3 | 7719.67 | 10375.8 | 8946.05 | 12068.4 | 7306.06 | 9759.99 | 8726.8 | 11681.3 | mean wet weight of adults |
| R | 1/d | 0 | 0.0525408 | 0 | 0.0515329 | 0 | 0.013367 | 0 | 0.0392971 | 0 | 0.00342643 | 0 | 0.0324156 | mean reproduction rate of adults |
| J_X | g/d | 579.551 | 756.368 | 574.596 | 748.892 | 489.363 | 629.871 | 535.879 | 686.893 | 466.838 | 597.778 | 513.44 | 651.423 | mean ingestion rate of wet food by post-natals |
| Y_PX | mol/mol | 0.109375 | 0.109375 | 0.109375 | 0.109375 | 0.109375 | 0.109375 | 0.109375 | 0.109375 | 0.109375 | 0.109375 | 0.109375 | 0.109375 | yield of faeces on food |
| Y_VX | mol/mol | 0.000503049 | 0.00595542 | 0.0011401 | 0.00648627 | 0.0203514 | 0.0220211 | 0.00782422 | 0.0123222 | 0.0283779 | 0.0288396 | 0.0130139 | 0.0169641 | yield of living structure on food |
| Y_VX_d | mol/mol | 0.000511684 | 0.000474723 | 0.0012709 | 0.00119943 | 1.1015e-09 | 9.67762e-10 | 0.00522143 | 0.00535679 | 4.69037e-10 | 4.17193e-10 | 0.00867615 | 0.00889692 | yield of dead structure on food |
| Y_EX | mol/mol | 0.000516808 | 0.00668604 | 0.0011733 | 0.00729457 | 0.0212251 | 0.0250976 | 0.00816014 | 0.0140437 | 0.0299881 | 0.0333039 | 0.0137523 | 0.0195902 | yield of living reserve on food |
| Y_EX_d | mol/mol | 0.000525679 | 0.000532963 | 0.00130791 | 0.0013489 | 1.14879e-09 | 1.10297e-09 | 0.00544559 | 0.00610517 | 4.95651e-10 | 4.81774e-10 | 0.00916845 | 0.0102742 | yield of dead reserve on food |
| Y_CX | mol/mol | 0.721961 | 0.712543 | 0.719658 | 0.710365 | 0.689852 | 0.685349 | 0.701979 | 0.692898 | 0.67621 | 0.673141 | 0.687387 | 0.678356 | yield of CO2 on food |
| Y_HX | mol/mol | 0.768611 | 0.758584 | 0.766159 | 0.756266 | 0.734427 | 0.729633 | 0.747337 | 0.73767 | 0.719904 | 0.716636 | 0.731802 | 0.722188 | yield of H2O on food |
| Y_OX | mol/mol | -0.916336 | -0.904381 | -0.913412 | -0.901618 | -0.875581 | -0.869866 | -0.890973 | -0.879447 | -0.858267 | -0.854372 | -0.872452 | -0.86099 | yield of O2 on food |
| Y_NX | mol/mol | 0.166606 | 0.164433 | 0.166075 | 0.16393 | 0.159197 | 0.158157 | 0.161995 | 0.159899 | 0.156049 | 0.15534 | 0.158628 | 0.156544 | yield of N-waste on food |
| mu_TX | J/mol | 463289 | 457290 | 461825 | 455903 | 442882 | 439968 | 450589 | 444776 | 434202 | 432182 | 441308 | 435505 | yield of heat on food |