Predictions & Data for this entry
| Model: hep | climate: Cfb, Dfb, Dfc | migrate: | phylum: |
| COMPLETE = 4.0 | ecozone: TH | food: beH, beD, beS | class: |
| MRE = 0.161 | habitat: 0eFl, 0eFp, 0eFm, eiTg | gender: D | order: |
| SMSE = 0.049 | embryo: Fv | reprod: Os | family: |
Zero-variate data
| Data | Observed | Predicted | (RE) | Unit | Description | Reference |
|---|---|---|---|---|---|---|
| ab | 10 | 8.109 | (0.1891) | d | age at birth | Wiki |
| tj | 30 | 34.74 | (0.1581) | d | time at emergence | Wiki |
| tp | 23.6 | 26.53 | (0.124) | d | time since birth at puberty | Baye2021 |
| tpj | 6.4 | 8.217 | (0.284) | d | time at emergence since puberty | Baye2021 |
| tp_c | 111.6 | 109.7 | (0.01646) | d | time since birth at puberty | Cian1979 |
| tj_c | 144 | 134.8 | (0.06436) | d | time at emergence | Cian1979 |
| am | 21 | 20.1 | (0.04279) | d | life span as imago | Wiki |
| L0 | 0.0167 | 0.01399 | (0.1623) | cm | egg length | Degr1960 |
| Lb | 0.0554 | 0.05195 | (0.06236) | cm | length at hatching | Degr1960 |
| Lp | 0.6845 | 0.5505 | (0.1958) | cm | body length female end of instar 6 | gaia2019 |
| Lj | 0.92 | 0.7713 | (0.1616) | cm | body length female sub-imago | Cian1979 |
| Lj_m | 0.82 | 0.7691 | (0.06208) | cm | body length male sub-imago | Cian1979 |
| Lj_w | 1.03 | 0.6656 | (0.3538) | cm | wing length female imago | Swee2018 |
| Wd0 | 0.0006 | 0.001306 | (1.176) | mg | initial dry weight | guess |
| Wdb | 0.0009 | 0.0004765 | (0.4705) | mg | dry weight at birth | Swee2018 |
| Wwj | 13.6 | 7.976 | (0.4135) | mg | wet weight female subimago | Cian1979 |
| Wwj_m | 8.2 | 7.902 | (0.0363) | mg | wet weight male subimago | Cian1979 |
| L1 | 0.1962 | 0.1801 | (0.08214) | cm | body length of instar 1 | gaia2019 |
| L2 | 0.263 | 0.2465 | (0.06292) | cm | body length of instar 2 | gaia2019 |
| L3 | 0.3654 | 0.3949 | (0.08074) | cm | body length of instar 3 | gaia2019 |
| L4 | 0.4988 | 0.4164 | (0.1651) | cm | body length of instar 4 | gaia2019 |
| L5 | 0.6015 | 0.5565 | (0.07488) | cm | body length of instar 5 | gaia2019 |
| L6 | 0.6845 | 0.7232 | (0.05648) | cm | body length of instar 6 | gaia2019 |
| L7 | 0.6703 | 0.8304 | (0.2389) | cm | body length of instar 7 | gaia2019 |
| L8 | 0.6745 | 0.9095 | (0.3484) | cm | body length of Nymph instar 1 | gaia2019 |
| L9 | 0.6695 | 0.9432 | (0.4088) | cm | body length of Nymph instar 2 | gaia2019 |
| Wd1 | 0.02078 | 0.01985 | (0.04454) | mg | dry weight of instar 1 | gaia2019 |
| Wd2 | 0.06111 | 0.05089 | (0.1672) | mg | dry weight of instar 2 | gaia2019 |
| Wd3 | 0.1175 | 0.2094 | (0.7812) | mg | dry weight of instar 3 | gaia2019 |
| Wd4 | 0.3216 | 0.2455 | (0.2367) | mg | dry weight of instar 4 | gaia2019 |
| Wd5 | 0.8554 | 0.5858 | (0.3152) | mg | dry weight of instar 5 | gaia2019 |
| Wd6 | 1.091 | 1.286 | (0.1779) | mg | dry weight of instar 6 | gaia2019 |
| Wd7 | 1.105 | 1.342 | (0.2147) | mg | dry weight of instar 7 | gaia2019 |
| Wd8 | 1.024 | 1.347 | (0.3144) | mg | dry weight of Nymph instar 1 | gaia2019 |
| Wd9 | 0.9199 | 0.6293 | (0.3159) | mg | dry weight of Nymph instar 2 | gaia2019 |
| Lh1 | 0.033 | 0.02374 | (0.2805) | cm | head length of instar 1 | gaia2019 |
| Lh2 | 0.0422 | 0.03249 | (0.23) | cm | head length of instar 2 | gaia2019 |
| Lh3 | 0.0584 | 0.05206 | (0.1085) | cm | head length of instar 3 | gaia2019 |
| Lh4 | 0.0732 | 0.0549 | (0.25) | cm | head length of instar 4 | gaia2019 |
| Lh5 | 0.0992 | 0.07336 | (0.2605) | cm | head length of instar 5 | gaia2019 |
| Lh6 | 0.1092 | 0.09534 | (0.1269) | cm | head length of instar 6 | gaia2019 |
| Lh7 | 0.1153 | 0.1095 | (0.05044) | cm | head length of instar 7 | gaia2019 |
| Lh8 | 0.1092 | 0.1199 | (0.09807) | cm | head length of Nymph instar 1 | gaia2019 |
| Lh9 | 0.1153 | 0.1244 | (0.07851) | cm | head length of Nymph instar 2 | gaia2019 |
| t5 | 4.6 | 3.258 | (0.2917) | d | duration of instar 5 | Baye2021 |
| t6 | 5.3 | 3.424 | (0.354) | d | duration of instar 6 | Baye2021 |
| t7 | 3 | 2.334 | (0.222) | d | duration of instar 7 | Baye2021 |
| t8 | 2.3 | 1.911 | (0.1692) | d | duration of instar 8 | Baye2021 |
| t9 | 1.1 | 0.9158 | (0.1675) | d | duration of instar 9 | Baye2021 |
| JX5 | 1.683e-05 | 1.886e-05 | (0.1204) | g | food uptake instar 5 | Baye2021 |
| JX6 | 4.175e-05 | 3.904e-05 | (0.06487) | g | food uptake instar 6 | Baye2021 |
| JX7 | 2.577e-05 | 2.341e-05 | (0.09162) | g | food uptake instar 7 | Baye2021 |
| JX8 | 1.485e-05 | 1.597e-05 | (0.07543) | g | food uptake instar 8 | Baye2021 |
| JX9 | 4.5e-07 | 4.802e-07 | (0.06704) | g | food uptake instar 9 | Baye2021 |
| N_HFT | 463.9 | 446.7 | (0.03697) | # | eggs/female at High Food Treatment | Beke2005 |
| N_MFT | 319.4 | 356.7 | (0.1165) | # | eggs/female at Medium Food Treatment | Beke2005 |
| N_LFT | 216.7 | 226.7 | (0.04649) | # | eggs/female at Low Food Treatment | Beke2005 |
Uni- and bivariate data
| Data | Figure | Independent variable | Dependent variable | (RE) | Reference |
|---|---|---|---|---|---|
| tL_f | 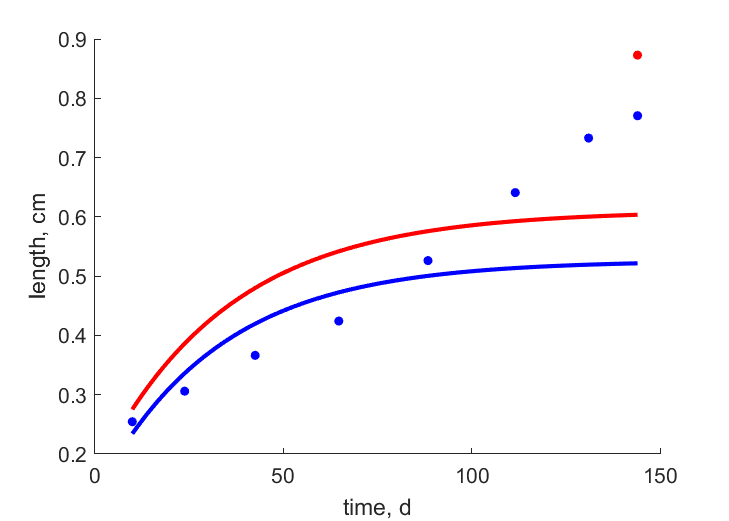  | time | length | (0.2773) | Cian1979 |
| tL_m | | time | length | (0.2778) | Cian1979 |
| tW_f | 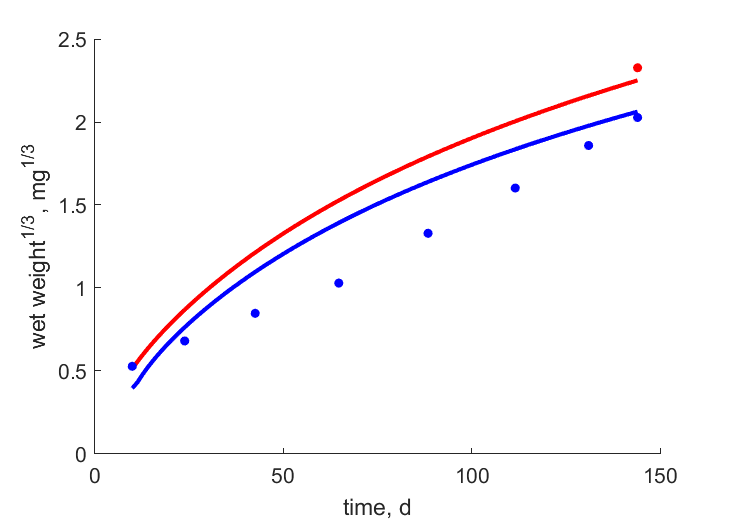  | time | wet weight | (0.2629) | Cian1979 |
| tW_m | | time | wet weight | (0.2605) | Cian1979 |
| LJO_f | 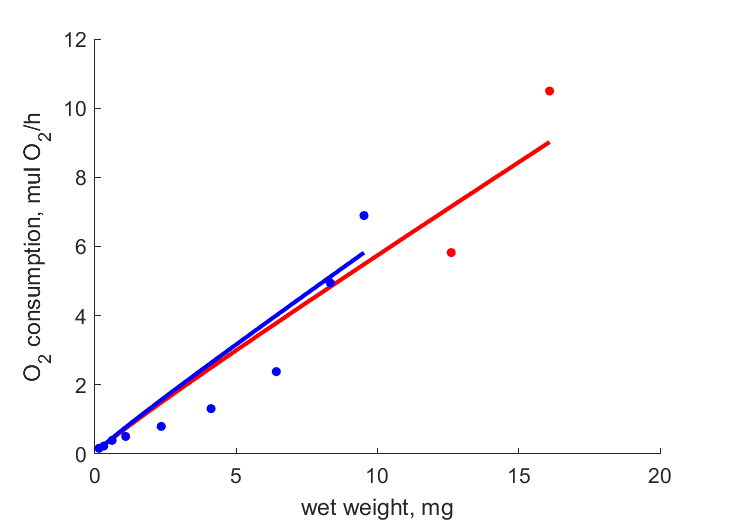  | length | O_2 consumption | (0.3929) | Cian1979 |
| LJO_m | | length | O_2 consumption | (0.3915) | Cian1979 |
| tL_f1 | 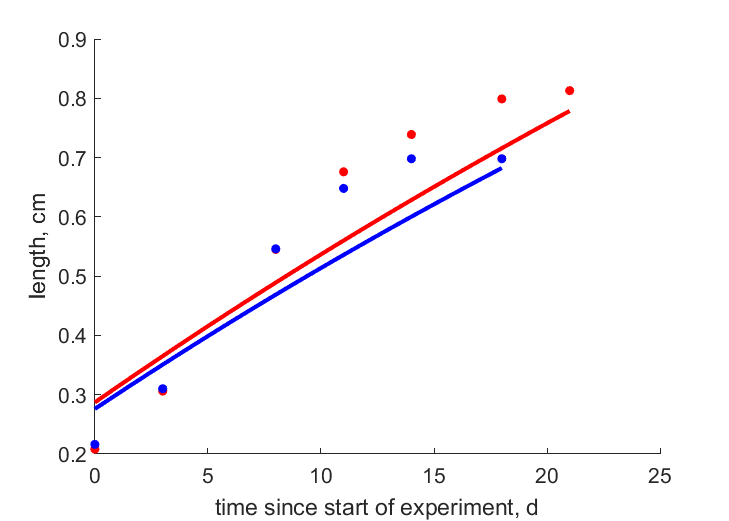  | time since start of experiment | length | (0.1353) | gaia2016 |
| tL_m1 | | time since start of experiment | length | (0.1424) | gaia2016 |
| tL_w | 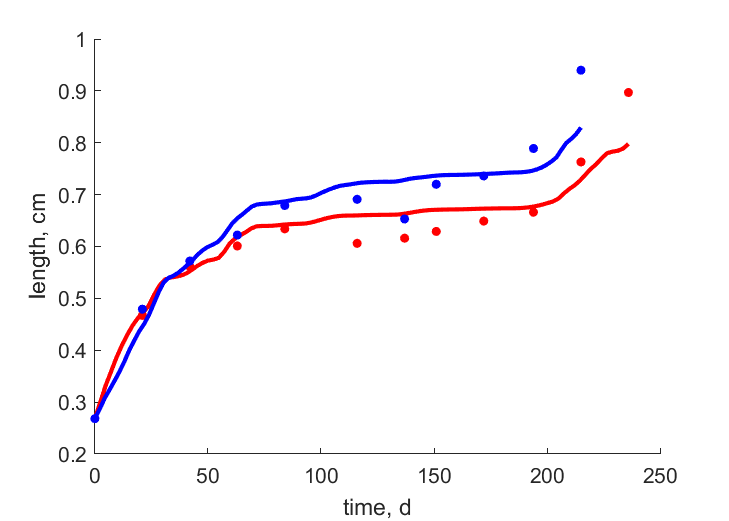  | time | length | (0.06758) | gaia2016 |
| tL_c | | time | length | (0.05718) | gaia2016 |
| tL_h1 |   | time since start of experiment | head length | (0.05633) | gaia2019 |
| tL_h2 | | time since start of experiment | head length | (0.05601) | gaia2019 |
| tL_h3 | | time since start of experiment | head length | (0.04776) | gaia2019 |
| tL_h4 | | time since start of experiment | head length | (0.2546) | gaia2019 |
| tL_h5 | | time since start of experiment | head length | (0.0357) | gaia2019 |
| tS | 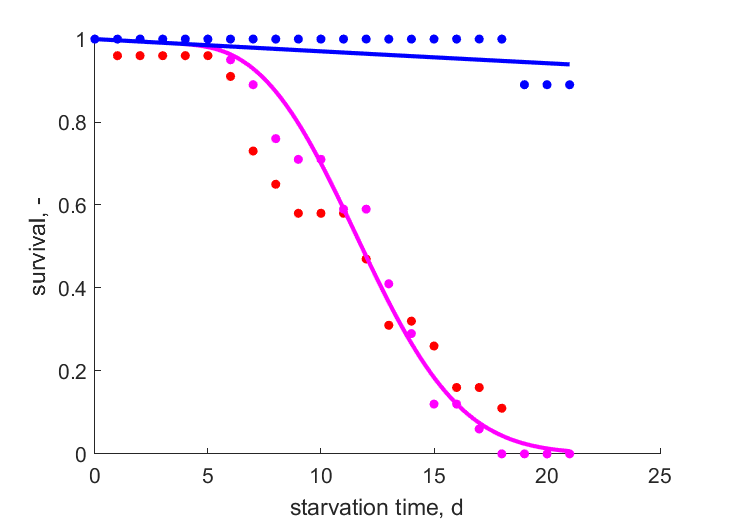  | starvation time | survival | (0.09937) | Wage2015 |
| tS_2 | | starvation time | survival | (0.09811) | Wage2015 |
| tS_3 | | starvation time | survival | (0.03005) | Wage2015 |
| WJO_T1 | 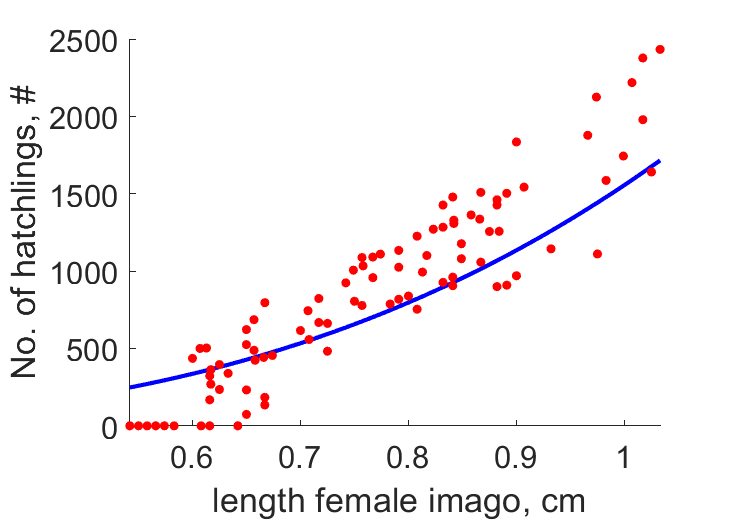  | wet weight | oxygen consumption | (0.2349) | Swee2018 |
| WJO_T2 | | wet weight | oxygen consumption | (0.1922) | Swee2018 |
| WJO_T3 | | wet weight | oxygen consumption | (0.3092) | Swee2018 |
| WJO_T4 | | wet weight | oxygen consumption | (0.1247) | Swee2018 |
| WJO_T5 | | wet weight | oxygen consumption | (0.2222) | Swee2018 |
| LWw_f | 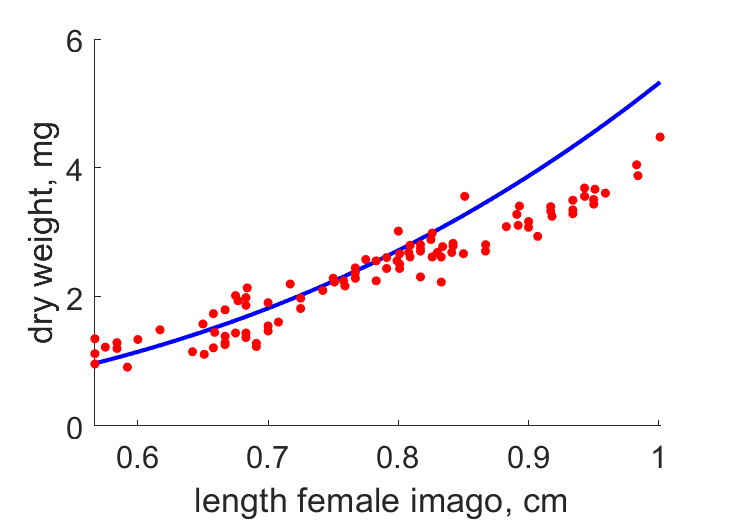  | length | wet weight | (0.1434) | Cian1979 |
| LWw_m | | length | wet weight | (0.1441) | Cian1979 |
| L_Wd | 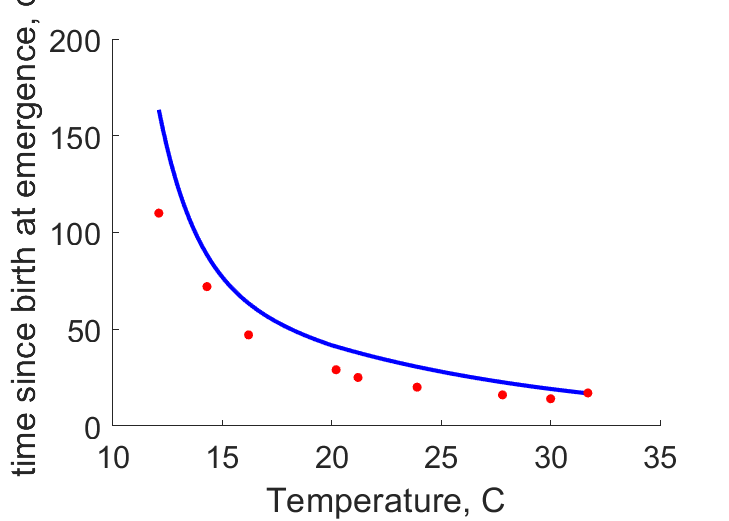 | body length female imago | dry weight | (0.1163) | Beck2011 |
| Lw_N | 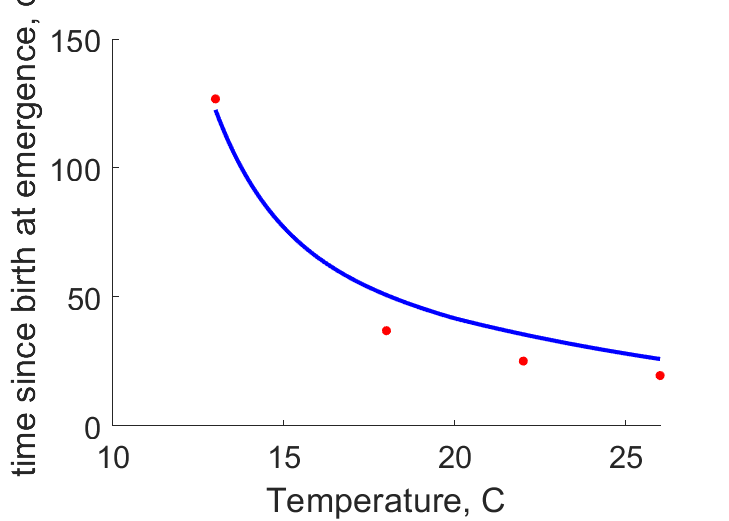 | wing length female imago | No. of hatchlings | (0.2893) | Swee2018 |
| Lw_Wd | 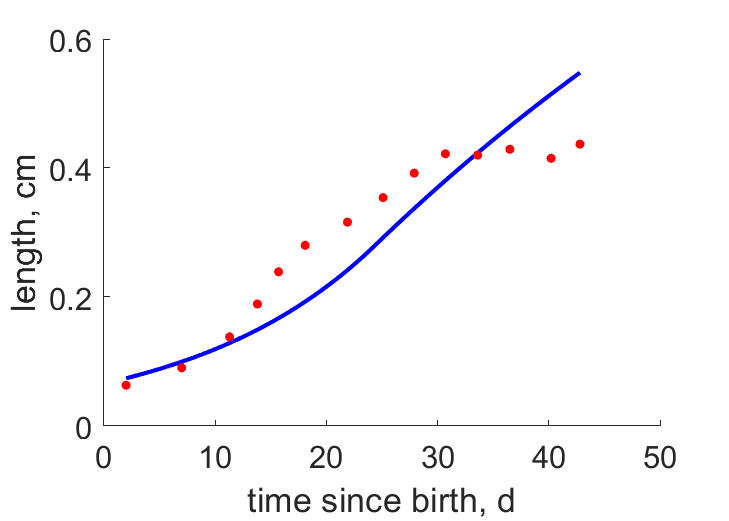 | wing length female imago | dry weight | (0.2277) | Swee2018 |
| Ttj | 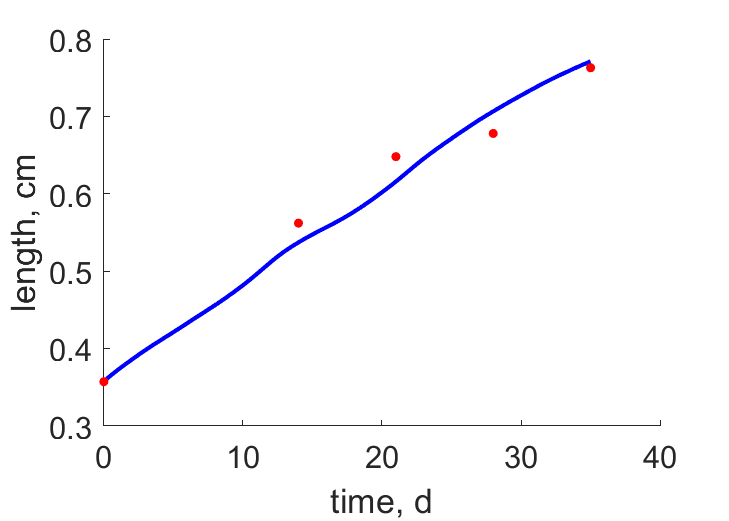 | Temperature | time since birth at emergence | (0.3669) | Swee2018 |
| Ttj_g |  | Temperature | time since birth at emergence | (0.2745) | gaia2019 |
| tL_g |  | time | length | (0.07468) | gaia2016 |
Pseudo-data at Tref = 20°C
| Data | Generalised animal | Cloeon dipterum | Unit | Description |
|---|---|---|---|---|
| v | 0.02 | 0.004306 | cm/d | energy conductance |
| p_M | 18 | 181.8 | J/d.cm^3 | vol-spec som maint |
| k_J | 0.002 | 0.03082 | 1/d | maturity maint rate coefficient |
| k | 0.99 | 0.9994 | - | maintenance ratio |
| kap | 0.8 | 0.72 | - | allocation fraction to soma |
| kap_G | 0.8 | 0.6032 | - | growth efficiency |
| kap_R | 0.95 | 0.95 | - | reproduction efficiency |
Discussion
- Males are assumed to differ from females by {p_Am} only
- tL and tW data are from wild-catch of unknown time since birth
- Food (periphyton) in experiments of gaia2016 was of high quality and therefore f = 1 was assumed
- hep-model is not entirely able to represent the sigmoidal growth of Cloeon larvae: late instars larvae do not grow in lenght anymore probably due to decreased feeding
- At low food, larval development time is prolonged, and size at emergence seems rather conserved across food levels
- Dry weight over temperature (Swee2018 data) cannot be predicted by the model
- mod_2: Many new data sets added
- mod_3: body length and weihgt of (female/male) imago (Cian1979 0-variate data) are computed with f /= 1, because of poor food conditions
- mod_3: The selection of the mainenance ratio k=0.99 as pseudo-data, is based on the implied property of the model that when k=1, stage transitions occur at fixed structural length
- mod_3: Puberty event was specified with information from Cian1979. L1-L6 are assumed juvenile, L7-sub-imago as adults
- mod_3: Dew data added
- mod_3: No matternal effect, which is the case for most aquatic species
- mod_3: dV is estimated to capture L-Wd data
- mod_3: Feeding is reduced after puberty
Facts
- The only ovoviviparous ephemeropteran species in Europe; Females lay eggs 10�14 days after mating, and the eggs hatch as soon as they hit the water (Ref: Wiki)
- Dry weight in mg = 0.001 * (body length in mm)^3.6802 (Ref: Cian1979)
- Females are 10% longer then males after larval stage 7 (Ref: Cian1979)
- Weights-at-stages and moulting frequency are unaffected by food quality, but duration is (so is the total number of moults) (Ref: Cian1979)
- Larval moults are 5% of dry body mass, 7.5% (female) or 11.5% (male) in N2, 13% (f) or 16% (m) in subimago (Ref: Cian1979)
- Wet/dry weight ratio is about 3 (Ref: Cian1979)
Bibliography